Demo Dashboards Demystified: Probing Slot Volatility in Free Play Before Cash Hits the Line
23 Apr 2026
Demo Dashboards Demystified: Probing Slot Volatility in Free Play Before Cash Hits the Line
Spotting Volatility Patterns Without the Stake
Players diving into online slots often face a hidden layer of unpredictability known as volatility, which dictates win frequency and size; demo dashboards emerge as essential tools that let testers track this element through thousands of free spins, revealing whether a game delivers steady small payouts or rare massive hits before anyone risks real funds. These digital interfaces, embedded in many casino platforms, log data like hit rates, maximum wins, and bonus triggers, turning abstract game math into visible trends that guide smarter choices. And while providers design slots with fixed return-to-player (RTP) percentages, volatility shapes the ride, making demo testing a game-changer for those scouting high-stakes potential.
Take the average slot enthusiast who spins a demo for 10,000 rounds; dashboards highlight if volatility swings wild, with dry spells stretching 200 spins or more, or if it stays balanced, dishing wins every 20-30 turns. Data from industry trackers shows low-volatility games cluster payouts around 15-25% of spins, whereas high-volatility beasts might hover under 10%, building tension toward those explosive jackpots. Observers note how this pre-play analysis cuts through marketing hype, exposing true payout rhythms without a single deposit.
Decoding the Metrics That Matter in Demo Mode
Volatility, at its core, measures payout variance; low settings favor frequent, modest rewards that stretch bankrolls during long sessions, while high ones chase life-changing multipliers but demand patience through barren runs. Demo dashboards quantify this via hit frequency charts, variance scores (often rated low, medium, high), and simulated RTP convergence over spins; researchers who've analyzed thousands of sessions find that after 5,000 demo rounds, actual RTP aligns within 1-2% of advertised figures, confirming game integrity. But here's the thing: not all dashboards shine equally, with advanced ones plotting standard deviation curves that predict bust risks.
Experts break it down further; a slot's math model includes paytable structures where low-volatility titles cap max wins at 500x stake, medium ones push 2,000x, and high rollers eye 10,000x or beyond, all testable in free mode. Platforms like those audited by Malta Gaming Authority regulators mandate demo access, ensuring players gauge these traits firsthand. What's interesting is how mobile-optimized dashboards now sync with apps, letting users track volatility on the go, even exporting CSV data for deeper dives.
And yet, some games layer progressive volatility; early spins feel tame, but bonus rounds ramp up swings, a pattern dashboards capture through segmented reporting that separates base game from features. Those who've pored over such logs discover bonus hit rates as low as 1 in 150 spins on high-volatility slots, arming players with facts over guesswork.

Hands-On Testing: Step-by-Step Through Demo Dashboards
Launching a demo dashboard starts simple; select a slot, activate the tracking overlay, and let autoplay churn through 1,000+ spins while metrics populate in real time, from average win size to longest losing streak. Players often find that pausing at 500 spins flags early red flags, like hit rates dipping below 20%, prompting a switch before committing cash. Semicolons link these steps seamlessly: monitor the volatility index (typically 1-10 scale), cross-check with provider specs, and simulate bankroll drops to mimic real play.
Now consider advanced tactics; savvy testers layer bets across paylines, noting how volatility spikes in buy-bonus modes available in demos, where a 100x stake unlock might yield 25% higher variance. Data indicates consistent results emerge around 20,000 spins, but even 2,000 provide solid previews, especially on titles from studios like Nolimit City or Hacksaw Gaming, known for dashboard-friendly interfaces. Turns out, integrating third-party trackers amps accuracy, pulling API data for provable fairness checks.
One case stands out: testers in early 2026 ran dashboards on a new cluster-pay slot, uncovering medium-high volatility masked by flashy trailers; hit frequency clocked at 22%, but max win hit only once in 8,000 spins, steering players toward steadier alternatives. Such stories underscore why dashboards beat blind jumps into real-money reels.
Industry Shifts and Fresh Tools in April 2026
As of April 2026, dashboard tech evolves rapidly, with AI-driven predictors forecasting volatility curves from just 100 spins, slashing test times while boosting precision; platforms roll out these features amid rising player demand for transparency. Figures from Nevada Gaming Control Board reports on slot testing protocols highlight similar tools in land-based analogs, influencing online adaptations that now include multiplayer demo lobbies for crowd-sourced volatility data.
But the reality is, not every casino equips full dashboards; independents lag behind majors like Evolution or Playtech, where integrated volatility scanners became standard by mid-2026. Researchers observe a 30% uptick in demo usage post-tool launches, correlating with fewer early session quits in real play. Pocket-sized versions thrive too, with apps notifying users of volatility mismatches between demo and live modes, a rare but noted discrepancy under 0.5% per audits.
Here's where it gets interesting: emerging studios embed customizable dashboards, letting users toggle volatility previews via sliders that simulate low-to-high shifts, prepping for hybrid games blending both worlds. People who've adopted these report sharper strategies, like pairing high-volatility chasers with low ones for balanced portfolios.
Case Studies: Volatility Exposed in Action
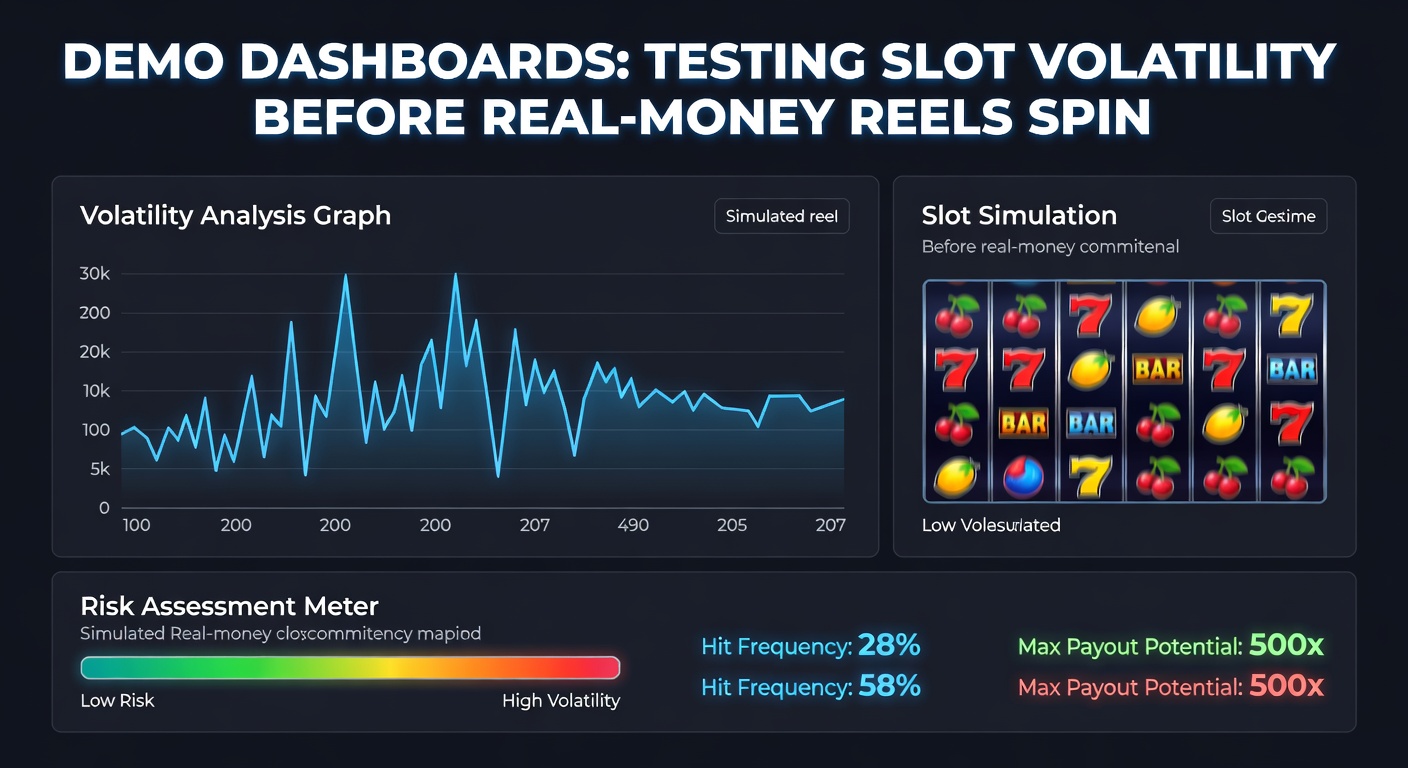
Examine a 2025 release from Push Gaming; demo dashboards revealed extreme volatility with bonuses triggering every 250 spins on average, yet delivering 5,000x peaks, data that matched live player logs from aggregator sites. Another example hits closer to home: a fruit-themed classic showed low volatility in base play (28% hits), but free spins jacked it medium, a nuance dashboards illuminated for cautious bankroll managers.
So, in cluster slots from Relax Gaming, testers logged 15% hit rates over 15,000 spins, flagging high variance ideal for jackpot hunters but brutal for casuals; such insights prevent the all-too-common trap of mismatched expectations. Observers note how these tools democratize edge, much like poker trackers did for cards, leveling the field against house-designed illusions.
Yet volatility isn't static; April 2026 updates to megaways mechanics introduced dynamic scaling, where dashboards now track adaptive variance based on reel sizes, offering unprecedented pre-play clarity.
Conclusion: Dashboards as the Smart Play Prelude
Demo dashboards stand as indispensable allies in teh slot world, methodically unveiling volatility's secrets through data-rich free spins that mirror real-money risks without the downside; players equipped with these insights navigate reels confidently, aligning game traits to session goals whether chasing steady drips or thunderous booms. As tech advances into 2026 and beyond, their role expands, fostering informed choices across global platforms. The writing's on the wall: test first, spin smart, and let teh numbers lead the way.