Slot Providers Fine-Tune Jackpot Frequencies to Optimize Mobile User Retention and Session Metrics
Erik Krüger · Aug 20, 2026
Slot Providers Fine-Tune Jackpot Frequencies to Optimize Mobile User Retention and Session Metrics
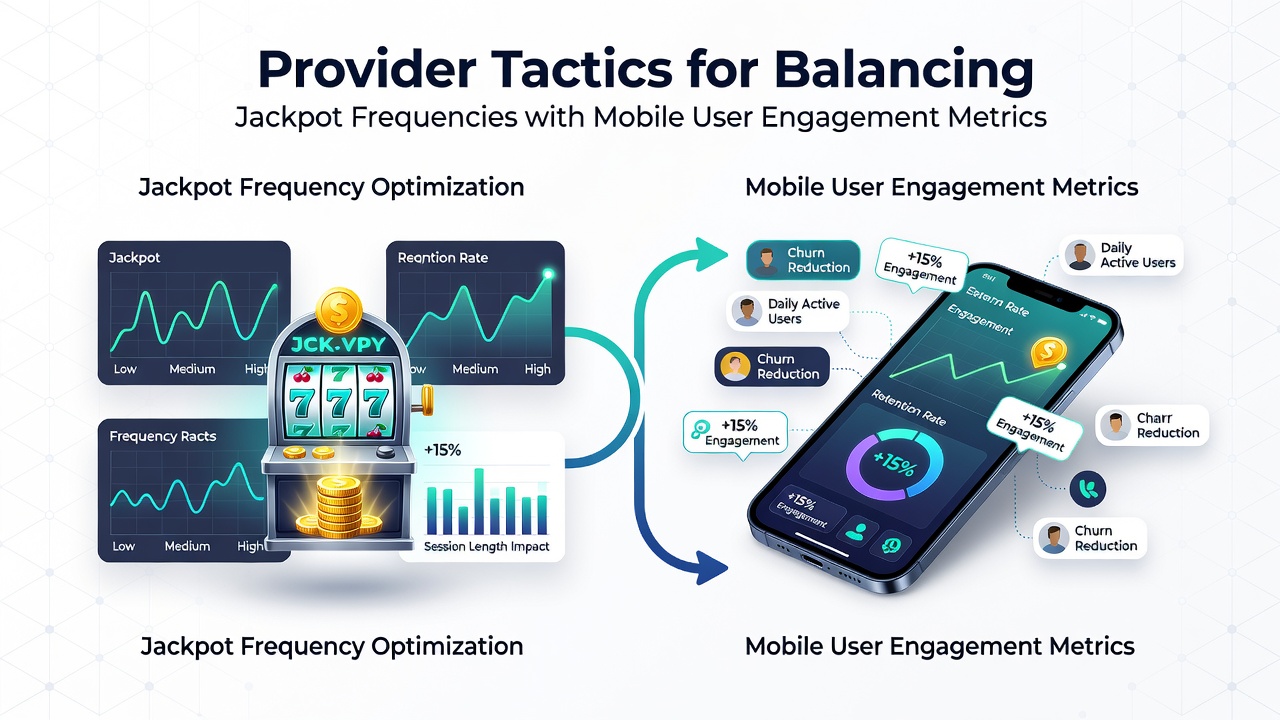
Slot providers track mobile engagement metrics such as average session duration, daily active users, and retention rates while they calibrate jackpot frequencies to maintain player interest across devices. Data from industry reports shows that frequent small jackpots can increase short-term spins yet risk lowering overall session length when users reach wins too quickly and exit the game. Providers therefore analyze heat maps of user behavior collected from thousands of sessions to determine optimal trigger rates that align with mobile usage patterns which often feature shorter but more frequent play windows.
Key Engagement Metrics Driving Adjustments
Analysts measure bounce rates within the first five minutes of a session alongside completion rates for bonus rounds because these figures reveal whether jackpot settings encourage continued play or prompt immediate departures. Research from the University of Nevada Las Vegas indicates that sessions exceeding eight minutes correlate strongly with higher lifetime value when jackpot hit rates sit between 1 in 150 and 1 in 250 spins depending on volatility settings. Providers cross-reference these numbers with device-specific data because mobile users exhibit different engagement curves compared to desktop players who tend toward longer uninterrupted sessions.
Technical Approaches to Frequency Calibration
Developers implement dynamic algorithms that adjust jackpot probabilities in real time based on aggregated anonymized player data streams while ensuring compliance with jurisdictional requirements. These systems monitor metrics including spin velocity per user and return-to-player consistency across thousands of mobile sessions then shift payout tables slightly to sustain interest without violating mathematical fairness parameters. One case study from a major European operator revealed that reducing jackpot frequency by 12 percent in a high-volatility title increased average session time by 22 percent among users aged 25 to 40 who played primarily on smartphones during commute periods.
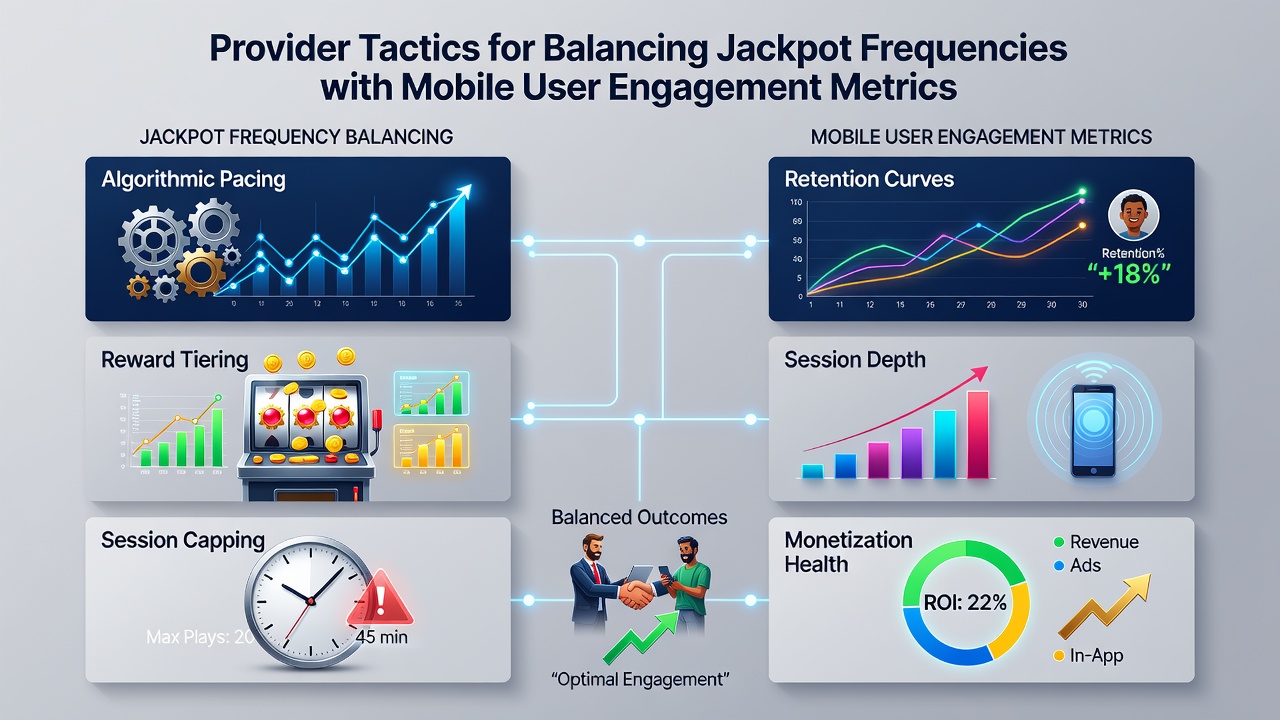
Providers also segment audiences by behavior clusters such as high-frequency low-stake players versus occasional big-bet users and apply differentiated frequency curves to each group. This segmentation relies on machine learning models trained on historical datasets that capture how jackpot announcements influence push notification open rates and subsequent login activity. Figures released by the American Gaming Association in August 2026 highlighted that titles with adaptive jackpot systems retained 18 percent more mobile users after 30 days compared to static configurations.
Integration with Broader Mobile Strategies
Jackpot tuning forms one component of larger engagement frameworks that incorporate free spin triggers, multiplier ladders, and personalized reward timing. Observers note that providers test variations through controlled A/B deployments across regional user bases before rolling out changes globally so that cultural differences in play style do not skew results. Data from the European Gaming and Betting Association shows mobile jackpot games with balanced frequencies maintain consistent daily active user counts even during periods of regulatory transition such as the updates scheduled for mid-2026.
Another tactic involves coupling jackpot visibility with engagement prompts like progress bars that fill toward the next trigger point because these visual cues encourage users to extend sessions rather than cash out early. Providers monitor click-through rates on these elements to refine presentation styles while keeping the underlying probability mathematics constant. Studies published by academic research groups have confirmed that transparent progress indicators reduce early exits by up to 15 percent when paired with moderate jackpot frequencies.
Conclusion
Providers continue refining jackpot frequency models by integrating fresh mobile engagement datasets collected throughout 2026 and beyond. These ongoing adjustments support sustained user activity across diverse markets while maintaining the mathematical integrity required by regulatory frameworks in multiple jurisdictions. The approach demonstrates how data-driven calibration connects directly to measurable outcomes in session length and retention without relying on static configurations that quickly lose effectiveness.